How to Read a VolleyLens Club Score
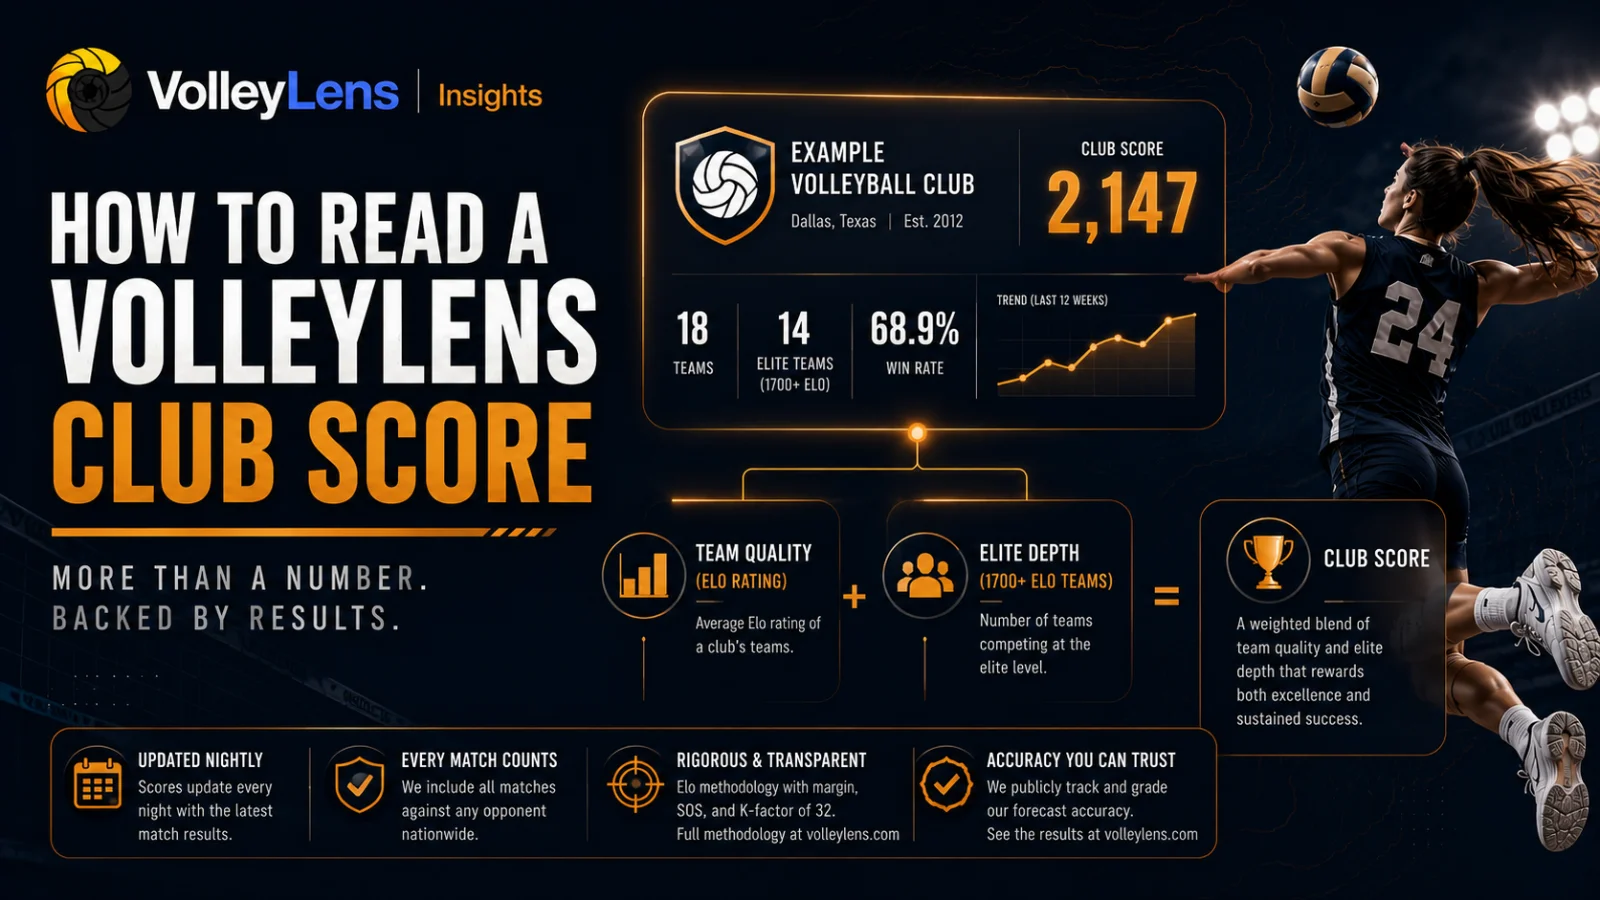
A VolleyLens club score is a single number that tells you how strong a volleyball club is overall, not just at one age — taking into account how good its best teams are, how deep its roster runs, what share of its teams compete at the elite level, and how consistently the program performs from one squad to the next. If you have ever looked at a club rankings page or a state Top-25 like the Ohio, Illinois, Texas, California, or Florida pieces and wondered what that 2,113 or 2,095 number actually means, this article walks through it in plain language with real worked examples.
We grade our own forecasts publicly on the accuracy page and document every component of the rankings in the full methodology guide. This piece is the short reader’s companion to that guide: same numbers, less mathematics, more "here is what to look at first."
What a club score actually is
The club score is a single composite number — usually somewhere between 1,400 and 2,200 — built from five components measured across every team in the club. A higher number means a stronger overall program. The components, with their weights from our methodology guide:
Elite Team Average (40%) — the average Elo rating of the club’s top 25% of teams. This is the single largest factor and answers the question "how good are your best teams?"
Depth Score (25%) — a weighted average of every team in the club with diminishing returns. Each additional strong team adds less than the one before it. This rewards programs that are good top-to-bottom, not just at the flagship age.
Team Quality Concentration (25%) — a ratio-based score that counts how many teams sit in each tier (Elite at 1700+, Premier at 1600-1699, Competitive at 1500-1599) plus a small bonus for program size. This is where elite-team count matters even when the average is dragged down by participation teams.
Consistency Score (10%) — a penalty for large Elo variance between teams in the club. A program where every team is a 1,800 Elo earns more here than a program with one 2,300 team and the rest at 1,200.
Age-group bonus and scale multiplier — small adjustments that account for the breadth of age groups served and the program’s overall scale. These are rounding-error effects on the final score; the first four components do almost all the work.
The math runs on every nightly Elo recompute — so the club score you see on a Tuesday morning reflects every match completed through Monday night.
The 1700-Elo "elite team" threshold — what it means, where it came from
A team’s Elo rating is its competitive grade — a number that goes up when the team wins and down when it loses, with adjustments for the strength of the opponent, the margin of victory, and the recency of the result. Elo is the same family of math that ranks chess players and pro sports teams; we tuned it for volleyball with a K-factor of 32 (which controls how fast the rating moves after each match) and added a strength-of-schedule multiplier.
The 1700-Elo line is the cutoff we use to label a team "elite." It is not arbitrary: in the 2024-2025 and 2025-2026 seasons we observed that teams above 1700 win about 65–70% of their matches against an average national opponent, and teams that qualify for AAU Junior Nationals Open Division or the USAV Girls Junior National Championships at any age level land overwhelmingly above this line. We picked 1700 because it cleanly separates the "competing for a national-tournament Open bid" cohort from the "competing for a regional bid or a strong local result" cohort.
The other tiers below 1700 also matter and inform the Team Quality Concentration component:
Elite: 1700+ — competing at the national-qualifier Open level.
Premier: 1600–1699 — competing at the national-qualifier USA level or strong regional level.
Competitive: 1500–1599 — competitive in regional play, mid-bracket at travel qualifiers.
Developing: 1400–1499 — winning local matches, developing toward regional competitiveness.
Emerging: Under 1400 — early-stage teams; almost every program has some.
A worked example: how 1st Alliance gets to a 2,113 club score
1st Alliance (Woodridge, Illinois) is the #4 girls club in the country for the 2025-2026 season with a VolleyLens club score of 2,113. Here is roughly how the formula gets there — not the exact math (we publish the formula and the inputs; the exact constants live in code), but the structural reading:
1st Alliance runs 36 teams, 30 of which sit above the 1700-Elo elite threshold — an 83% elite-team density. Walk through the components in order:
Elite Team Average (40% weight). Their top 25% — the top 9 teams of 36 — average above 2,000 Elo. The flagship squad, 1st Alliance 16-Gold, sits at 2,293 Elo (#9 nationally in the 16s, 41-14 season record). Several other top-bracket teams sit between 1,900 and 2,200. The elite-team average pulls the club score up hard.
Depth Score (25% weight). Across all 36 teams the diminishing-returns weighted average is high because 30 of those teams are elite. Even the lower-ranked teams in the program are competitive — the variance is compressed near the top.
Team Quality Concentration (25% weight). 30 elite (1700+), several more Premier, very few in the lower tiers — and 36 total teams supplies a small size bonus. This component does well on both the elite count and the size.
Consistency Score (10% weight). Variance is moderate-low. Not a perfect spread, but no team sits at 1,200 while another sits at 2,300. The consistency penalty is small.
Combine all four (plus the age-group and scale adjustments) and you land in the low 2,100s. That is the structural shape of a national top-5 program: high elite-team average, broad elite density, controlled variance, real program scale. The flagship squad’s Elo (2,293) and the club composite (2,113) sit close together because the depth chart is doing the work — not just one team.
Different shapes, same "best in state"
Here is a structural fact worth knowing before you compare two clubs: two clubs can both be #1 in their state with totally different program shapes. The composite score smooths over the shape; the underlying components tell you where the strength lives. Compare the four girls-state #1s we have profiled in detail:
Texas Advantage (TAV) — #1 in Texas, #2 nationally, club score 2,146. Runs 18 teams with 14 elite (78% density), 68.6% overall win rate. The "small, dense, ruthless" archetype. Almost every team competes at or near the national level.
SC Rockstar — #1 in California, #11 nationally, club score 2,071. Runs 35 teams with 18 elite (51% density), 57.8% overall win rate. The "broader-base SoCal model" — large pool, half of it elite. Different operating shape, similar overall composite.
Elevation (3120) — #1 in Ohio, #7 nationally, club score 2,095. Runs 22 teams with 20 elite (91% density), 63.8% win rate. The densest top-1 club in any state we have profiled, by a wide margin. Almost every team in the program is elite.
1st Alliance — #1 in Illinois, #4 nationally, club score 2,113. Runs 36 teams with 30 elite (83% density), 72.7% win rate. The "big and dense" model — both the scale of a Texas Advantage and the density of an Elevation. The only non-warm-weather club in the national top 10.
Same #1-in-state status, very different shapes. TAV is small and intense; SC Rockstar is broad and competitive; Elevation is small and almost completely elite; 1st Alliance is the rare program that operates at scale and density together. If you are a parent trying to compare two clubs, the club score is the first cut — but the team count and elite-density numbers tell you what kind of program you are looking at.
The participation-first model versus the elite-density model
At the opposite end of the spectrum from Elevation’s 91% density and 1st Alliance’s 83%, there are clubs in the same state Top-25 lists that run an entirely different model. Two clean examples from the state pieces:
Premier (Toledo, OH) — 105 teams, 18 elite (17% density), club score 1,843 (#9 in Ohio). One of the largest rosters in any state Top-25 we have published. The flagship team competes nationally, but most of the program is at the developmental and competitive tiers.
Club Fusion (Batavia, IL) — 128 teams, 17 elite (13% density), club score 1,817 (#13 in Illinois). The largest roster in the Illinois Top-25. Same pattern: one or two high-end flagship squads, a very large developmental and house-team base behind them.
Both are legitimate program shapes. The participation-first model — Premier, Club Fusion, and many others — serves a different parent question: "is there a place for my emerging player here, and will the club grow with her?" The elite-density model — Elevation, TAV, 1st Alliance — answers a different question: "are most of the teams here already at the level my player is trying to reach?" The club score reflects both shapes, but a parent should look at the team count and elite-density before reading the score alone.
A useful rule of thumb: if a club score is in the same neighborhood (say, within 30 points), a club with twice the elite team count has fundamentally more "I can train against my level every day" surface area than a club with twice the total team count. Both shapes have legitimate uses; they answer different questions.
What the club score does NOT measure
Five things the club score is silent on, all of which matter when picking a club but none of which we can pick up from match results alone:
Coaching staff continuity and quality. We do not know who is on the bench. A first-year head coach and a 20-year head coach score identically in this model.
Recruiting placement. We do not yet track college commitments at the club level. A club that places eight 18s players into D1 programs and one that places zero are indistinguishable in this composite. This is a known gap; we are working on filling it.
Tuition and travel cost. A $4,000-per-season club and a $12,000-per-season club look the same to us. They do not look the same to a family.
Practice intensity and time commitment. Some elite-density programs practice four nights a week; some practice twice. Both can land in the same club-score bucket.
Cultural fit, scholarship policy, alumni network. The score is one number. It does not replace conversation with current parents at the club, watching a practice, or reading the parent contract.
Reading a club score as a parent: composite vs flagship Elo vs win rate
When you land on a club page, you will typically see three numbers at the top: the club score (the composite covered above), the flagship team Elo (the rating of the highest-rated team in the club), and the overall win rate (the percentage of matches the club’s teams won across the season nationwide). Each tells you something different:
Club score answers "how strong is the overall program?" Use this for state-level and national-level comparisons.
Flagship team Elo answers "how strong is the best team in the program?" Use this if you are asking whether the very top of the club competes at the national level. A flagship Elo of 2,200+ is a national-qualifier-level squad.
Overall win rate answers "do the club’s teams win most of their matches?" Watch out: this is heavily affected by the strength of the schedule. A club that travels nationally to AAU Junior Nationals and the AES Big South Open will absorb more losses than a club that plays primarily in-state — even if the traveling club is structurally stronger. Read win rate together with the club score.
A common parent mistake is to compare two clubs purely on win rate. Win rate is a real signal, but it is the noisiest of the three. The cleanest comparison uses club score for "how strong is the overall program," flagship Elo for "how strong is the top squad in the age my player is in," and win rate as a sanity check on the schedule.
How rankings update
The club score is recomputed nightly. Every match completed and reported during the day flows into the Elo update overnight; the new club composites are computed from the updated team Elos in the same pass. The rankings hub and the per-club, per-state, and per-region pages all read from the same nightly cache.
In practice this means: a club that wins big at a national qualifier this weekend may rise three or four spots by Monday morning. A club that loses several matches at the same event may drop. The numbers move continuously through the spring qualifier season (February through May) and stabilize during the off-season. The state Top-25 articles snapshot the state of play on the publish date; the live state rankings pages show the moving picture.
Frequently asked questions
What is a VolleyLens club score?
A VolleyLens club score is a single composite number — usually between 1,400 and 2,200 — that measures the overall strength of a volleyball club. It combines the average Elo of the club’s top teams (40% weight), the depth across all teams (25%), the concentration of teams in the elite and premier tiers (25%), and a small consistency penalty (10%), plus minor adjustments. A higher number means a stronger overall program. It is recomputed nightly from real match results.
What does an Elo rating in volleyball mean?
An Elo rating is a team’s competitive grade — a number that rises when the team wins and falls when it loses, weighted by the strength of the opponent, the margin of victory, and the recency of the result. VolleyLens uses a K-factor of 32 (controls how fast the rating moves) with a strength-of-schedule multiplier. A team Elo of 2,000 is a strong regional squad; 2,200+ is a national-qualifier-level team. The 1700 line marks the "elite" tier.
What is the 1700-Elo elite threshold?
The 1700-Elo line is the cutoff VolleyLens uses to label a team "elite." Teams above 1700 win about 65–70% of their matches against an average national opponent, and they make up the bulk of national-qualifier Open Division participants at every age level. We picked the number because it cleanly separates the "competing for an Open bid" cohort from "competing for a USA bid or a regional bid" cohort.
How is a club score calculated?
The formula in the methodology guide: Club Score = (Elite Team Avg × 0.40) + (Depth Score × 0.25) + (Team Quality Concentration × 0.25) + (Consistency Score × 0.10) + age-group and scale adjustments. Elite Team Avg is the average Elo of the top 25% of teams. Depth Score is a weighted average of all teams with diminishing returns. Team Quality Concentration counts how many teams sit in each performance tier. Consistency Score penalizes wide variance between teams. The first four components do almost all the work.
What are the five club tiers?
Within a club, every team falls into one of five tiers based on Elo: Elite (1700+) — national-qualifier Open level; Premier (1600–1699) — national-qualifier USA or strong regional; Competitive (1500–1599) — competitive in regional play; Developing (1400–1499) — winning local matches, developing toward regional play; Emerging (under 1400) — early-stage teams. The Team Quality Concentration component of the club score weighs how many teams sit in each tier.
What does "elite-team density" mean?
Elite-team density is the share of a club’s teams that sit above the 1700-Elo elite threshold — calculated as elite teams ÷ total teams. A club with 22 total teams and 20 elite teams has a 91% density (Elevation in Ohio — the densest top-25 club in any state we have profiled). A club with 105 total teams and 18 elite teams has a 17% density (Premier in Toledo — a participation-first model). Both are legitimate program shapes that answer different questions.
What is the highest possible club score?
In practice, the top of the national rankings sits between 2,100 and 2,200. Texas Advantage leads the country at 2,146 for the 2025-2026 season. There is no hard upper cap on the formula, but reaching 2,200 would require a club where the elite team average is near 2,200 (extremely rare across enough teams to make the average reliable) and the depth and concentration components are also near their ceilings. A club score above 2,000 is national top-25 caliber; above 2,100 is top-10 caliber.
Why does a club with more wins sometimes rank below a club with fewer wins?
Because the club score is built from Elo, not from raw win-loss records. Elo accounts for the strength of the opponents you played and beat. A club that goes 40-20 against a strong national schedule will out-score a club that goes 50-5 against a weaker local schedule, because the wins against stronger opponents move Elo more than the losses to similarly strong opponents move it down. The overall win rate you see on the club page is informational; the club score and the flagship Elo are the strength-adjusted measures.
How often do club scores update?
Every night. Matches completed and reported during the day flow into the nightly Elo recompute; the updated team Elos roll up into the updated club scores in the same pass. The number you see on the rankings hub on a Tuesday morning reflects every match through Monday night.
Should I pick a club purely by its club score?
No. The club score answers "how strong is the overall program?" It does not answer "is this the right club for my family?" Coaching continuity, recruiting placement, tuition, practice intensity, travel cost, and cultural fit all matter — none of them are inside the score. The club score is the first cut; talk to current parents at the club before you decide. The right way to use rankings is to narrow the field — not to make the final call.
What is the difference between a club score and a flagship team Elo?
A club score is the composite across the entire program — every team contributes (with the top 25% getting the most weight). A flagship team Elo is the rating of the single highest-rated team in the club. They tell you different things. Two clubs can have similar club scores (say, both around 1,900) but very different flagship Elos: one might have a 2,200-Elo top team and an average roster behind it, while the other has a 1,950-Elo top team and a very even roster. For "is my player going to find a team at her level?" the flagship Elo matters; for "is the whole program strong?" the club score matters.
Where can I find the live rankings?
The national club rankings hub lists every ranked club, updated nightly. The state rankings show clubs by state. Individual club pages show every team in the program with its current Elo and tier. The state Top-25 articles — Ohio, Illinois, Texas, California, Florida — provide editorial snapshots that contextualize the live numbers.
Further reading
Full methodology: How VolleyLens ranks volleyball clubs
Forecast track record: VolleyLens accuracy page
Live national club rankings: all ranked clubs
State Top-25 series: Ohio, Illinois, Texas, California, Florida.
By Leo Marushevskyi, founder of VolleyLens. Have a correction or want to add data? Contact us.
By Leo Marushevskyi